
A 10-year review: getting Safer & But Room For Improvement
“We learn through our experiences” or better still, the experiences of others. I’ve avoided the word “mistakes” because we also learn through good experiences. The information presented here is collected from the FAA and other public sources. Keep in mind that a lot of events go unreported. In this review, we’re going to look at the PA46 fleet data from 2009 through October 2018.
The past 10 years have seen the worst year ever (2015) and the best in two decades (2016). There’s really no particular explanation for the huge differences. Our sample is very small meaning a single event can sway the numbers in a big way. Statistically, we base our percentages on an average of 150-hour per flying aircraft and we remove airframes that have been destroyed/parted out or deregistered following an event. It’s far from perfect. Some fly more, some less and the “experts” I’ve talked to say it’s about as good a guess as we can make without auditing the aircraft logbooks.
The PA46 vs. the Rest of GA
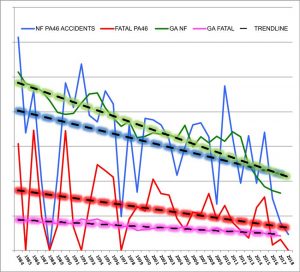
So how do we compare? A look back to the beginning reflects a continuing safety improvement since the line was introduced. Our non-fatal event count descends steadily and is now nearly a match to the rest of general aviation. The Malibu was the first production single engine pressurized GA aircraft certified for Flight In Known Icing (FIKI) and the initial fatal accident rate reflects the challenges it presented. Training and experience allowed a steady, albeit slow improvement and we are now very close to the GA average. In 2017, the GA fatal rate was .84 per 100,000 hours and the PA46 rate was .65. Because of our low numbers, one more fatal accident would have pushed our rate to approximately .98.
If we compare today’s GA rates to 1950, we’ll see the non-fatal rate drop from 46.6 to 3.3 and the fatal rate from 5.1 to .84. We continue to make progress, but we’ll never be finished. Ron Machado remarked a few years back that a rate less than 1.0 per 100,000 was really in the noise level and that it would be extremely hard to do much better. Agreed, but that doesn’t keep us from trying.
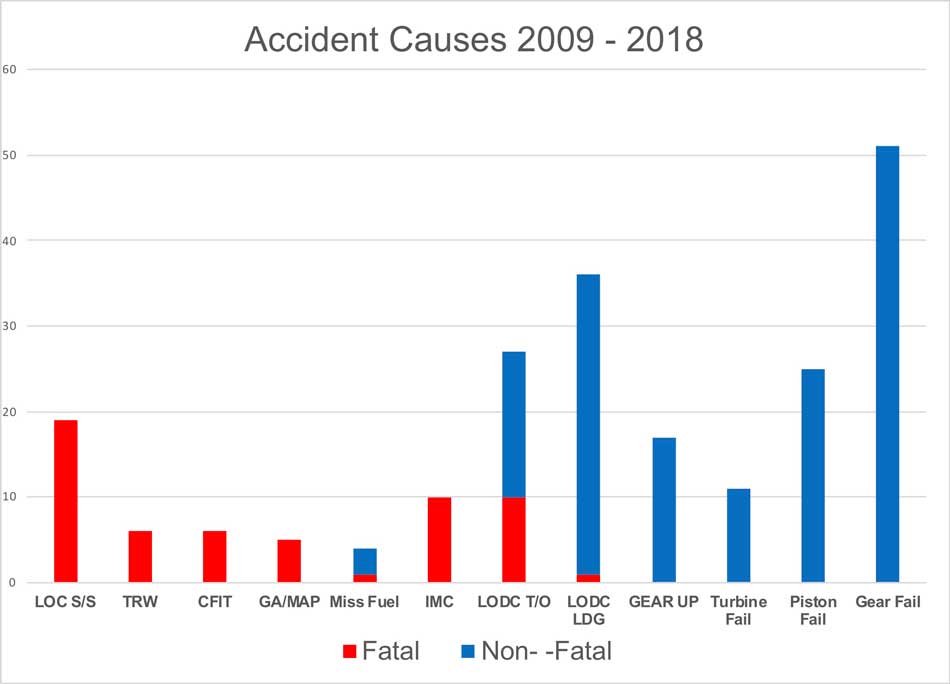
Some notes on the graphs. The lines between the different categories are blurred because most accidents have more than one risk factor. A departure into IMC can result in a Loss of control, i.e. stall/spin. I felt it prudent to call out the areas were our issues lie (the numbers will not add up). I also revised the data to separate Loss of Control (LOC) into takeoffs, landings and accidents were a stall/spin were probable. My new term, Loss of Directional Control (LODC), refers to events during runway operations.
LOC & LODC
Loss of Control in-flight is always lethal (stall/spin). I’ve often said, “In a PA46, if you land under control and don’t hit anything head-on, you’ll walk away.” If you land out of control (stall/spin) you’re not going to survive. The gateway to this category is weather. Most of these accidents involved convection, icing, IMC or a combination. Our last three fatal accidents involved convection/icing and they also included a connection to datalink weather. With weather in the lead, it’s more than appropriate we re-evaluate our weather savoy. It seems the government wants to get out of the briefing business and focus on producing on-line weather products. There is a significant shift in this jigsaw puzzle approach that assumes any pilot can build a complete picture from the hundreds of weather products available online. The time and effort needed to do it properly may be more than some are capable or willing to invest. If you’re not comfortable in this environment, limit your exposure.
The LODC on takeoff has a higher probability of being serious due to the high angle of attack, high power and overweight conditions. Three of our fatal accidents were departures into IMC and two involved convective activity; all with fatal results. On the non-fatal side, five were triggered by loss of engine power/failure. At least three involved seriously overloaded aircraft.
I had an opportunity to work as an expert witness on a fatal accident trial that focused on pilot negligence. One of the plaintiff’s arguments centered on pilot negligence because the aircraft was about 10 pounds over the maximum landing weight at the time of the accident. Although not causal, it bears out the importance of respecting the POH limits.
The LODC on landing is normally a low-power, lighter-weight scenario and is understandably less lethal. The single fatality involved an expedited return combined with a stall/spin. The remaining 35 instances resulted in few injuries but lots of damage (read insurance). Your MMOPA Safety Committee introduced “Operational Practices” at the convention in the hopes of reducing the variances we see in day-to-day operations. One of the standout areas involves the “stabilized approach.” This somewhat mysterious maneuver involves approaching a runway at the correct speed without large or rapid changes in pitch, power or airspeed. Those who arrive unstabilized, too fast and at or near the crosswind limits are destined to join the less fortunate.
 Pilot Distraction & High-Stress Flights
Most of you cannot fathom a situation where a pilot was SO distracted they forgot to lower the gear. It happens more often than you think, and YOU are not immune. Family issues, primary emergencies and in-flight distractions can overwhelm the best of us. My research shows several cases where a primary system issue (engine/gear/electrical) or weather triggered the oversight. Electrical leads the way, backed up by the fear of a fire. The emergency gear extension would have worked in most of these situations. Problem is, folks were so distracted (and we can understand) that they either didn’t try or didn’t slow down enough and the nose gear didn’t lock. Jonathan Sisk, your MMOPA Ombudsman, manufactured some reminder stickers that can be stuck on the emergency gear extension knob as a last chance reminder. If you’d like one, let Executive Director Dianne White know.
Gear-up landings and gear failures are not counted as accidents unless they result in injury or aircraft structural damage. The redesigned engine mounts for the Mirage and Matrix have reduced the number of mount failures but they have not totally eliminated the problem, especially for aircraft that still have the old-style mounts or pilots who have not recognized the value of a stabilized approach (see above). Not solved: Towing issues. Try to supervise whenever possible.
Our monthly accident rate overview changed a bit, and it seems to be leveling. We still see a boost over the summer/winter holidays when we use our fabulous machines for travel. These trips tend to be high stress as we strive to impress our relatives with the wonderfulness of GA. Of course, the weather during the holidays is usually hostile, which adds to the stress. Have your mechanic tune up your cold-weather systems and your instructor tune up your piloting skills.
Mechanical/Fuel Issues
The debate over engine reliability continues. We experience about one turbine issue per year; generally, a roll-back of some sort related to fuel control unit settings, low NG or temperature issues with the fuel/oil heat exchanger.
The piston fleet sees an average of 2.5 failures per year. A couple were fuel management issues and included misfueling, fuel quality issues, or poor fuel planning. We’ve had one confirmed misfueling, resulting in a fatality and two or three suspected fuel contamination events. Three of our in-flight failures in the Continental ships were suspect fuel icing events. Further investigation indicates that water in the fuel was a likely cause. Problems with leaky caps or tainted fuel sources can expose the operator to increased risk. Fuel exhaustion resulted in deadstick landings for a Mirage in Arizona and a Malibu in Mexico in the past 24 months (not something that points to the engine manufacturer). There were a couple catastrophic engine failures and an untold number of turbo failures.
LODC landing and gear failures share many of the same areas including pilot technique, crosswinds, tire failure, rigging, towing damage and the like. I counted 51 events between 2009 and October 2018. It can be hard to figure out the exact cause and, in many cases, the pilot did everything right. Consider checking your gear/tires as often and thoroughly as you check your oil.
Weakest Link?
The pilot remains the weakest link in the process. We plan the flight, conduct the preflight, determine the fuel requirements and control the loading. As pilots, we also evaluate the weather before and during the flight and we make the decision to “press-on,” divert or not go at all. With rare exception, we can control the outcome. Ensuring the safety of ourselves and our loved ones is a responsibility not to be taken lightly. Be safe out there and remember “There’s nowhere you need to be or nothing you need to do that’s more important than your safety!”
[PUT THE FOLLOWING IN A BOX]
Facts at a Glance
PA46’s added to the fleet: 770
Approximate number of hours flown: 2.7 M
Aircraft added:
Mirage: 287
Matrix: 127
Meridian M500: 265
Meridian M600: 91
[SECOND BOX]
Number of Accidents: Fatal/Non-Fatal
NOTE: *Gear collapses” are not always considered accidents.
| Aircraft Type | Fatal | Non-fatal |
| Malibu | 8 | 17 |
| Malibu JP | 2 | 4 |
| Mirage | 13 | 33 |
| Mirage JP | 5 | 14 |
| Matrix | 1 | 5 |
| Meridian M500 | 8 | 17 |
| Meridian M600 | 0 | 0 |
| Number of Fatal Accidents/Fatalities: | 38 | 90 |
| Total number of events 228 (Accidents/Incidents/Other) | ||
by David McVinnie